class: middle, center <!--- https://katex.org/docs/supported.html#macros ---> $$ \global\def\myx#1{{\color{green}\mathbf{x}\_{#1}}} $$ $$ \global\def\mys#1{{\color{green}\mathbf{s}\_{#1}}} $$ $$ \global\def\myz#1{{\color{brown}\mathbf{z}\_{#1}}} $$ $$ \global\def\myhnmf#1{{\color{brown}\mathbf{h}\_{#1}}} $$ $$ \global\def\myztilde#1{{\color{brown}\tilde{\mathbf{z}}\_{#1}}} $$ $$ \global\def\myu#1{\mathbf{u}\_{#1}} $$ $$ \global\def\mya#1{\mathbf{a}\_{#1}} $$ $$ \global\def\myv#1{\mathbf{v}\_{#1}} $$ $$ \global\def\mythetaz{\theta\_\myz{}} $$ $$ \global\def\mythetax{\theta\_\myx{}} $$ $$ \global\def\mythetas{\theta\_\mys{}} $$ $$ \global\def\mythetaa{\theta\_\mya{}} $$ $$ \global\def\bs#1{{\boldsymbol{#1}}} $$ $$ \global\def\diag{\text{diag}} $$ $$ \global\def\mbf{\mathbf} $$ $$ \global\def\myh#1{{\color{purple}\mbf{h}\_{#1}}} $$ $$ \global\def\myhfw#1{{\color{purple}\overrightarrow{\mbf{h}}\_{#1}}} $$ $$ \global\def\myhbw#1{{\color{purple}\overleftarrow{\mbf{h}}\_{#1}}} $$ $$ \global\def\myg#1{{\color{purple}\mbf{g}\_{#1}}} $$ $$ \global\def\mygfw#1{{\color{purple}\overrightarrow{\mbf{g}}\_{#1}}} $$ $$ \global\def\mygbw#1{{\color{purple}\overleftarrow{\mbf{g}}\_{#1}}} $$ $$ \global\def\neq{\mathrel{\char`≠}} $$ # Spatial Audio .vspace[ ] .center[Simon Leglaive] .vspace[ ] .small.center[2D-3D Image & Sound, CentraleSupélec] --- class: middle ## Today - Auralization - Sound propagation in free-field and rooms - Room impulse response - Source separation based on spatial diversity --- class: middle, center # Introduction --- class: middle ## The acoustic space There can be no sound without a medium allowing for the propagation of acoustic waves. Let’s consider a sound source in a room (e.g. a speaker or musical instrument): .grid[ .kol-3-5[ - The signal recorded by a microphone does not only characterize the sound source. - It corresponds to the image of the sound source as it is heard through the acoustic space of the recording medium. - This source image depends on the the **recording environment**, the **position of the source** and the **position of the microphone(s)**. ] .kol-2-5[ .width-100[] ] ] --- class: middle ## Example of the room effect .grid[ .kol-1-2[ .center[Original recording of Donald Trump.] .width-100[] .center[<audio controls src="audio/trump_cut.wav"></audio>] ] .kol-1-2[ ] ] --- class: middle .grid[ .kol-1-2[ .center[Donald Trump in a bathroom.] .width-100[] .center[<audio controls src="audio/trump_bathroom.wav"></audio>] ] .kol-1-2[ ] ] --- class: middle .grid[ .kol-1-2[ .center[Donald Trump in a concert hall.] .width-100[] .center[<audio controls src="audio/trump_usina.wav"></audio>] ] .kol-1-2[ ] ] --- class: middle .grid[ .kol-1-2[ .center[Donald Trump locked in the Inchindown oil tanks in Scotland.] .width-100[] .center[<audio controls src="audio/trump_inchindown.wav"></audio>] ] .kol-1-2[ .center[World’s longest reverberation.] .center.width-90[] .center.width-70[] ] ] --- class: middle .grid[ .kol-1-3[.width-100[]] .kol-1-3[.width-100[]] .kol-1-3[.width-95[]] ] - The acoustic space has a great influence on the recorded audio signal. - **Reverberation may for instance affect the intelligibility of a speech signal**. This is not a problem in the case of Donald Trump's hate speech, but generally speaking it makes extraction of information challenging for machine listening systems. --- class: middle Understanding the effects of the acoustic space on audio source signals is important - to build **robust machine listening systems**, - to **design a concert hall** in architectural acoustics, - to **synthesize virtual acoustic environments** in video games, - etc. --- class: middle To create a truly immersive virtual reality experience, all our senses have to be involved. **Being able to hear spatial sounds that match with what we see and how we move is very important.** .caption[3D audio demo (built with Unity) of the [Resonance Audio project](https://resonance-audio.github.io/resonance-audio/) developed by Google (use earphones or a headset). ] .center[<iframe width="560" height="315" src="https://www.youtube.com/embed/Wl8axtBNdQw" title="YouTube video player" frameborder="0" allow="accelerometer; autoplay; clipboard-write; encrypted-media; gyroscope; picture-in-picture" allowfullscreen></iframe>] .question.center[Listen how the spatial characterisitics of acoustic sources change as the player moves, and how different rooms have different acoustics.] --- class: middle ## Auralization We did not actually lock Donald Trump in the Inchindown oil tanks. The previous examples used the principle of **auralization**. .alert[Auralization is the process of creating a .bold[virtual rendition of a sound in a space.] An auralized sound corresponds to the .bold[convolution] of an .bold[anechoic sound] with a .bold[room impulse response]. ] Auralization ingredients: - **Anechoic sound**: a sound recorded in an acoustic environment with (almost) no reflections. - **Room impulse response** (RIR): characterizes the acoustic path between two points in a room, including the reflections on the walls, floor, ceiling, objects, etc. --- class: middle ## Convolution reminder .grid[ .kol-1-2[ The convolution between two signals $u(t)$ and $v(t)$ is defined for all $t \in \mathbb{Z}$ by: $$ \begin{aligned} \[u \star v\](t) &= \sum\_{\tau \in \mathbb{Z}} u(\tau) v(t-\tau) \\\\ &= \sum\_{\tau \in \mathbb{Z}} v(\tau) u(t-\tau). \end{aligned} $$ .small-vspace[ ] .small[Commutativity:] <br> $ \footnotesize \[u \star v\](t) = \[v \star u\](t) $ <br> .small[Associativity:] <br> $ \footnotesize \[(u \star v) \star w\](t) = \[u \star (v \star w)\](t) $ <br> .small[Linearity:] <br> $ \footnotesize \[u \star (\lambda\_1 v + \lambda\_2 w)\](t) = \lambda\_1 \[u \star v\](t) + \lambda\_2 \[u \star w\](t) $ ] .kol-1-2[ .right.width-90[] ] ] --- class: middle, center # Sound propagation in free field Before studying auralization in rooms, let's focus on auralization in free field. --- class: middle ## Free field .alert.bold[The free field is an idealized situation in which there are no sound reflections.] .grid[ .kol-1-2[ - In nature (open air environment), free field conditions can only be found if there is no close obstacle and sound reflections on the floor can be neglected, e.g. in new snow. - Free field conditions can be artificially produced in **anechoic chambers**. They are used for **acoustic measurements** and **sound perception experiments**, as results are only influenced by the sound of the source and not by the properties of the room. ] .kol-1-2[ .right.width-90[] .caption[Anechoic chamber at IRCAM, Paris. <br> Image credits: Philippe Barbosa, Le Monde.] ] ] --- class: middle .grid[ .kol-3-5[ - Let us consider a man holding a balloon and a microphone in an open air environment without any obstacle. .italic[We assume the man and the microphone are not reflecting sound.] - The baloon explodes, it produces a source signal $s(t)$. ] .kol-2-5[ .right.width-90[] ] ] .question.center[How is the source signal $s(t)$ related to the microphone signal $x(t)$?] --- class: middle .grid[ .kol-3-5[ The signal acquired by the microphone is given by $$ x(t) = \frac{1}{\sqrt{4 \pi}d} s\left(t - \frac{d}{c}f\_s\right) $$ where - $d$ is the source-to-microphone distance (in m); - $c = 343$ is the speed of sound (in m/s at 20°C); - $d/c$ is the time of arrival (in s); - $f\_s$ is the sampling rate (in Hz). ] .kol-2-5[ .right.width-90[] ] ] .alert[At the microphone, the source signal is simply .bold[attenuated] and .bold[delayed]. This is an .bold[anechoic recording].] --- class: middle .grid[ .kol-3-5[ We can rewrite the microphone signal as: $$ x(t) = \[h \star s \](t) $$ where $$ h(t) = \frac{1}{\sqrt{4 \pi}d} \delta\left(t - \frac{d}{c}f\_s\right), \qquad \delta(t) = \begin{cases} 1 & t = 0 \\\\ 0 & t \neq 0 \end{cases}.$$ ] .kol-2-5[ .right.width-90[] ] ] .alert[$ h(t) $ characterizes the acoustic path between the source and the microphone.] --- class: middle ## Multi-microphone setting .grid[ .kol-3-5[ - In a multi-microphone recording, we have different attenuations and delays at each microphone $i$: $$ x\_i(t) = \frac{1}{\sqrt{4 \pi}d\_i} s\left(t - \frac{d\_i}{c}f\_s\right) $$ ] .kol-2-5[ .right.width-100[] ] ] - Without loss of generality, we can absorb the attenuation and delay parameters at the first microphone into the definition of the source signal (change of variable): $$ x\_1(t) = s(t), \qquad x\_2(t) = \boxed{\frac{d\_1}{d\_2}}\, s\left(t - \boxed{\frac{d\_2 - d\_1}{c}}\, f\_s\right). $$ .alert[The .bold[level ratio] and the .bold[time difference of arrival] (TDoA) between the microphones convey information about the .bold[position of the source].] --- class: middle ## Far-field case .grid[ .kol-3-5[ Assuming the source-to-microphone distances are large compared with the inter-microphone distances: - the level ratio is almost equal to one: $$ \frac{d\_1}{d\_2} \approx 1, $$ - the TDoA is fully characterized by the direction of arrival (DoA): $$ \frac{d\_2 - d\_1}{c} = \frac{\ell}{c} \cos(\theta), $$ where $\ell$ is the inter-microphone distance (in m) and $\theta$ is the DoA angle. ] .kol-2-5[ .center[.width-70[]] ] ] --- class: middle, center ## Practical Activity #1 Anechoic auralization --- class: middle, center # Sound propagation in rooms --- class: middle ## Room impulse response The room can be considered as a causal, linear and time-invariant system (if we neglect the changes in temperature, pressures, etc.) so we still have $$ x(t) = \[h \star s \](t), $$ where $h(t) = 0$ for $t < 0$ due to causality. .alert[$h(t)$ is called the .bold[room impulse response] (RIR) and it characterizes the .bold[acoustic path between two points in the room], for instance the source and microphone locations. The source signal is filtered by the room impulse response. ] --- class: middle It is called the room .italic[impulse] response because it is the response of the room when the excitation is an impulse (dirac delta function): $$x(t) = \[h \star \delta \](t) = h(t).$$ .center.width-60[] --- class: middle ## Schematic illustration of an RIR .width-100[] The **direct path** is the first one to arrive at the microphone. --- class: middle ## Schematic illustration of an RIR .width-100[] Then come the first significant reflections (e.g. on the floor) called the **early echoes**. --- class: middle ## Schematic illustration of an RIR .width-100[] After some time, echoes have bounced many times on the room surfaces, and we have so many reflections that arrive simultaneously that we cannot distinguish them individually, this is called **late reverberation**. --- class: middle .alert[ When a source emits sound in a room, many successive reflections typically occur before the sound power becomes negligible, this is called .bold[reverberation]. Reverberation is induced by .bold[multiple propagation paths between the source and the microphone], each with a different delay and attenuation factor. ] --- class: middle - In this **simple RIR model**, we only consider **specular reflections** that are each characterized by an attenuation factor and a delay. - In rooms, sound propagation is more complicated than this. When a sound wave propagates in a room, in encounters surfaces with which it interacts in different ways: .width-100[] .credit[Image credits: Diego Di Carlo’s Ph.D. Thesis [“Echo-aware signal processing for audio scene analysis”](https://tel.archives-ouvertes.fr/tel-03133271v2/document), 2020.] ??? Specular reflection: The direction of the reflected wave is symmetrical to the direction of the incident wave with respect to the surface normal. Diffuse reflection: The wave may be reflected in many directions depending on its avelength and the dimension and irregularities of the surface. Diffraction: The wave is diffracted in a way that depends on its wavelength, the shape of the obstacle or opening, its material and the angle of incidence. Refraction and absoption: The absorption ratio depends on the material and the angle of incidence. --- class: middle ## Simulating RIRs - We can **simulate RIRs based on the geometry of the room**. - The simplest method is called the image source method. It uses the previous simple attenuation + delay model. - Below is a simulation of the acoustics in the Church of the Redentore in Venice. .center.width-60[] .credit[Image credit: Braxton Boren/American Univ.] --- class: middle ## Measuring RIRs - We can measure RIRs in order to capture the acoustics of a room. .width-90[] - These RIRs were measured in a room with a configurable reverberation level. The source and microphone are fixed, but the room characteristics are changed, resulting in three different **reverberation times**. --- class: middle .alert[The reverberation time is the time it takes for the sound energy to decrease by 60 dB after extinction of the source.] .center.width-50[] --- class: middle .grid[ .kol-1-3[ .width-100[] ] .kol-2-3[ .big-vspace[ ] .width-100[] ] ] Brian Katz, a CNRS researcher, measured RIRs in Notre Dame de Paris in 2013. These data may help restoring the acoustics of the cathedral. .credit[More info: https://www.sciencenews.org/article/notre-dame-cathedral-fire-legendary-acoustics-restoration] --- class: middle .center[<iframe width="840" height="470" src="https://www.youtube.com/embed/mvdW7qtQXpg" title="YouTube video player" frameborder="0" allow="accelerometer; autoplay; clipboard-write; encrypted-media; gyroscope; picture-in-picture" allowfullscreen></iframe>] A virtual reality simulation of a concert in Notre Dame, a work-in-progress by Brian Katz and colleagues, re-creates the acoustics of the church. In this clip from the 360-degree video, the sound changes as the viewer moves around the cathedral. .credit[Video: Brian Katz and David Poirier-Quinot/CNRS, Sorbonne University] --- class: middle, center ## Source separation exploiting the spatial diversity in anechoic acoustic recordings .vspace[ ] The Degenerate Unmixing Estimation Technique (DUET) .small[(S. Rickard, 2007)] .credit.left[S. Rickard, ["The DUET Blind Source Separation Algorithm"](https://pdfs.semanticscholar.org/1413/746141f2871e0f45056a7696e019b8f8a100.pdf), 2007.] --- class: middle ## Unmixing or source separation We want to estimate individual speech source signals from an **anechoic stereophonic mixture**. .center.width-40[] .center[ <audio controls src="audio/duet_mix.wav"></audio>] If we have more than 2 source signals, the problem is under-determined or **degenerate**. --- class: middle ## Anechoic stereo mixture model in the time domain $$ \begin{aligned} x\_1(t) &= \sum\_{j=1}^J s\_j(t), \qquad x\_2(t) &= \sum\_{j=1}^J a\_j s\_j(t - \delta\_j), \end{aligned} $$ where - $s\_j(t)$ denotes the $j$-th source signal; - $a\_j = d\_{1j}/d\_{2j}$ is the **relative attenuation factor** corresponding to the ratio of the attenuations of the paths between the $j$-th source and the microphones. - $\delta\_j = \displaystyle \frac{d\_{2j} - d\_{1j}}{c} f\_s$ is the **arrival delay** (TDoA) between the microphones for the $j$-th source . In the following, we will refer to $\left\\{({a}\_j,{\delta}\_j)\right\\}\_{j=1}^J$ as the **mixing parameters**. --- class: middle ## Anechoic stereo mixture model in the STFT domain Assuming that the TDoAs are small relative to the STFT analysis window length $L$, we have: $$ s\_j(t-\delta\_j) \overset{\text{STFT}}{\longleftrightarrow} \exp\left({-\imath 2 \pi \frac{f \delta\_j}{L}}\right) S\_j(f, n). $$ The mixture model thus rewrites in STFT domain as follows: $$ \begin{aligned} X\_1(f,n) &= \sum\_{j=1}^J S\_j(f,n), \qquad X\_2(f,n) &= \sum\_{j=1}^J a\_j \exp\left({-\imath 2 \pi \frac{f \delta\_j}{L}}\right) S\_j(f, n), \end{aligned} $$ or equivalently in matrix form: $$ \begin{bmatrix} X\_{1}(f, n) \\\\ X\_{2}(f, n) \end{bmatrix} = \begin{bmatrix} 1 & ... & 1 \\\\ a\_1 \exp\left({ \displaystyle -\imath 2 \pi \frac{f\delta\_1}{L} }\right) & ... & a\_J \exp\left({ \displaystyle -\imath 2 \pi \frac{f\delta\_J}{L} }\right) \end{bmatrix} \begin{bmatrix} S\_{1}(f, n) \\\\ \vdots \\\\ S\_{J}(f, n) \end{bmatrix}. $$ --- class: middle ## DUET principle .alert.left[ It is possible to blindly separate an arbitrary number of sources from .bold[two anechoic mixtures] provided that - the .bold[time–frequency representations of the sources do not overlap] (assumption 1), - the sources have .bold[different spatial locations] (assumption 2). ] --- class: middle ## W-disjoint orthogonality .small[(assumption 1)] - Source signals have disjoint time-frequency supports. In other words, **at most one source is active at each time-frequency point $(f,n)$**. - The W-disjoint orthogonality hypothesis can be formalized by: $$ S\_{j}(f,n)S\_{k}(f,n) = 0, \qquad \forall (f,n), \qquad \forall j \neq k.$$ - The mixture model simplifies as follows: $$ \begin{bmatrix} X\_{1}(f,n) \\\\ X\_{2}(f,n) \end{bmatrix} = \begin{bmatrix} 1 \\\\ a\_{\mathcal{I}(f,n)} \exp\left({\displaystyle -\imath 2 \pi \frac{f\delta\_{\mathcal{I}(f,n)}}{L} }\right) \end{bmatrix} S\_{\mathcal{I}(f,n)}(f, n). $$ where $\mathcal{I}(f,n) \in \\{1,2,...,J \\}$ indicates which source is active at time-frequency point $(f,n)$. - It is the mathematical idealization of a milder assumption considering that **every time–frequency point in the mixture is dominated by the contribution of at most one source**. --- class: middle .grid[ .kol-1-3[ .caption[Source 1] .width-100[] ] .kol-1-3[ .caption[Source 2] .width-100[] ] .kol-1-3[ .caption[Source 3] .width-95[] ] ] .small-nvspace[ .kol-2-3[ .center.caption[Source 2 $\times$ Source 3: Most of time-frequency points indeed have low energy.] .center.width-60[] ] .kol-1-3[ .big-vspace[ ] .center.italic["All models are wrong, but some are useful."] .center.small[George E. P. Box (British statistician)] ] ] --- class: middle ## Unmixing with binary masking W-disjoint orthogonality is crucial to DUET because it allows for separating the mixture into its component sources using **binary masks**: $$ \hat{S}\_{j}(f,n) = M\_{j}(f,n) X\_1(f,n),$$ where the mask is defined by: $$ M\_j(f,n) = \begin{cases} 1 & \text{if } \mathcal{I}(f,n) = j \\\\ 0 & \text{otherwise} \\\\ \end{cases}. $$ .alert[ .bold[The problem now is to estimate which source is active at each time-frequency point.] This is where the second assumption of DUET comes into play. ] --- class: middle ## DUET algorithm Let us recall the mixture model under the W-disjoint orthogonality assumption: $$ \begin{bmatrix} X\_{1}(f,n) \\\\ X\_{2}(f,n) \end{bmatrix} = \begin{bmatrix} 1 \\\\ a\_{\mathcal{I}(f,n)} \exp\left({\displaystyle -\imath 2 \pi \frac{f\delta\_{\mathcal{I}(f,n)}}{L} }\right) \end{bmatrix} S\_{\mathcal{I}(f,n)}(f, n). $$ .alert[ The main observation that DUET leverages is that .bold[the ratio of the mixtures in the STFT domain does not depend on the source signal but only on the mixing parameters associated with the active source]: $$ \frac{X\_{2}(f,n)}{X\_{1}(f,n)} = a\_j\exp\left({-\imath 2 \pi \frac{f\delta\_j}{L}}\right), \qquad \forall (f, n) \in \Omega\_j = \\{(f,n),\, \mathcal{I}(f,n) = j\\}. $$ ] --- class: middle - Let us define the **local attenuations** and **delays** by: $$ \hat{a}(f,n) = \left|\frac{X\_{2}(f,n)}{X\_{1}(f,n)}\right|,$$ $$ \hat{\delta}(f,n) = -\frac{1}{2 \pi f/L}\arg\left(\frac{X\_{2}(f,n)}{X\_{1}(f,n)}\right), \qquad f > 0.$$ - Using the key observation in the previous slide, we have: $$ \Big(\hat{a}(f,n), \hat{\delta}(f,n)\Big) = \Big(a\_j, \delta_j\Big), \qquad \forall (f, n) \in \Omega\_j = \\{(f,n),\, \mathcal{I}(f,n) = j\\}. $$ --- class: middle ## Spatial diversity .small[(assumption 2)] .alert[ We assume that the .bold[sources have different spatial locations], that is $$ (a\_j \neq a\_k) \text{ or } (\delta\_j \neq \delta\_k), \qquad \forall j \neq k. $$ .medium[We recall that $a\_j$ and $\delta\_j$ encode the position of the $j$-th source relative to the microphones.] ] .center.width-40[] --- class: middle ## 2D histogram of local attenuations and delays The local attenuations and delays that are computed from the mixture signals can thus **only take values among the actual mixing parameters that are assumed to be all different**: $$ \big(\hat{a}(f,n), \hat{\delta}(f,n)\big) \in \\{(a\_j, \delta\_j)\\}\_{j=1}^J, \qquad \forall (f,n). $$ .question.center[ What should we obtain if we build a 2D histogram of the local attenuations and delays $\big(\hat{a}(f,n), \hat{\delta}(f,n)\big)$? ] --- class: middle, center .grid[ .kol-1-2[ .width-95[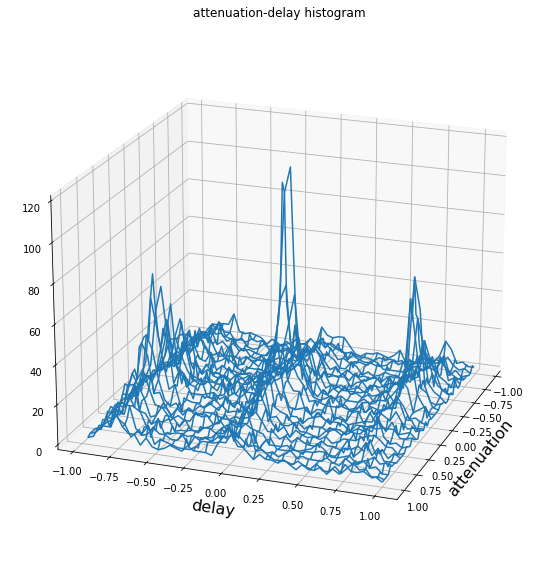] ] .kol-1-2[ .width-95[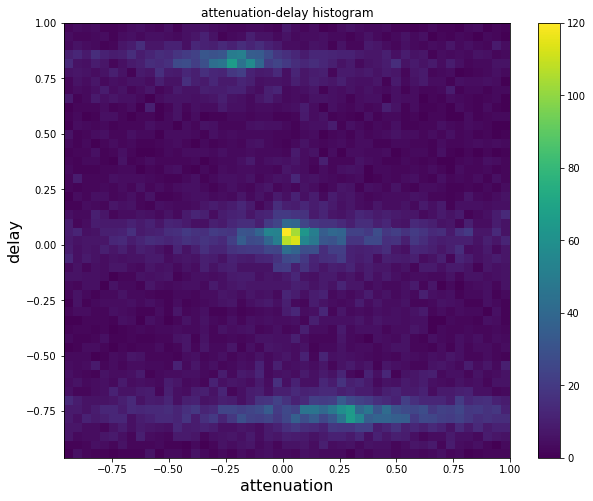] ] ] .small-nvspace[ ] The observations do not perfectly match with the model, but we can still identify three clusters. --- class: middle - From the 2D histogram, we can estimate the mixing parameters $\\{(\hat{a}\_j, \hat{\delta}\_j)\\}\_{j=1}^J$ by peak picking. - We recall that in principle, for all time-frequency points $(f,n)$, $$ \big(\hat{a}(f,n), \hat{\delta}(f,n)\big) \in \\{(\hat{a}\_j, \hat{\delta}\_j)\\}\_{j=1}^J.$$ - We can thus build the time-frequency masks for source separation as follows: $$ M\_j(f, n) = \begin{cases} 1 & \text{if } \big(\hat{a}(f,n), \hat{\delta}(f,n)\big) = (\hat{a}\_j, \hat{\delta}\_j) \\\\ 0 & \text{otherwise} \end{cases}. $$ - In practice, because not all the assumptions are strictly satisfied, the local attenuations and delays will not be precisely equal to the estimated mixing parameters, but they will cluster around them. We will **need a metric** to measure the proximity. --- class: middle ## Summary of DUET 1. Construct the STFT representations $X\_1(f,n)$ and $X\_2(f,n)$ of both mixtures. 2. Take the ratio of the two mixtures and extract local attenuations and delays $$\left\\{\big(\hat{a}(f,n), \hat{\delta}(f,n)\big)\right\\}\_{(f,n)}.$$ 3. Compute a 2D histogram and estimate the mixing parameters $\left\\{(\hat{a}\_j, \hat{\delta}\_j)\right\\}\_{j=1}^J$ by peak picking. 4. Build the binary masks $$ M\_j(f, n) = \begin{cases} 1 & \text{if } \big(\hat{a}(f,n), \hat{\delta}(f,n)\big) \approx (\hat{a}\_j, \hat{\delta}\_j) \\\\ 0 & \text{otherwise} \end{cases}. $$ 5. Estimate the sources by $ \hat{S}\_{j}(f,n) = M\_{j}(f,n) X\_1(f,n)$. 6. Compute the inverse STFT to get the time-domain source signals. --- class: middle, center .center[<audio controls src="audio/duet_mix.wav"></audio>] .grid[ .kol-1-3[ .caption[Mask 1] .width-100[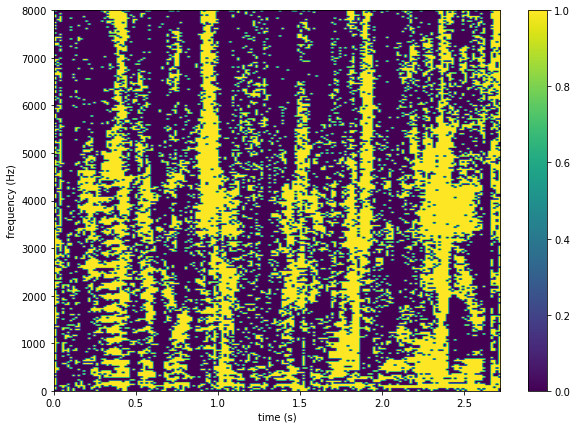] .center[<audio controls src="audio/est_src1.wav"></audio>] ] .kol-1-3[ .caption[Mask 2] .width-100[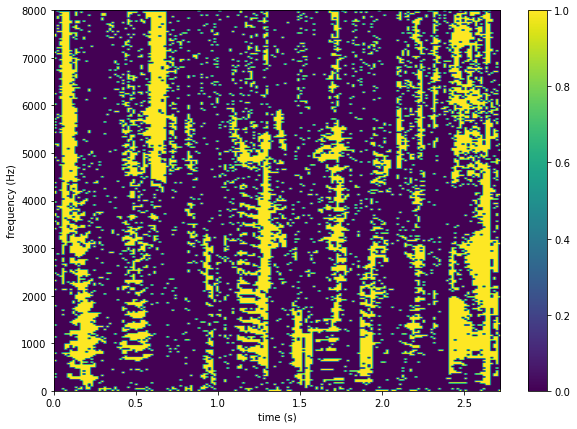] .center[<audio controls src="audio/est_src2.wav"></audio>] ] .kol-1-3[ .caption[Mask 3] .width-95[] .center[<audio controls src="audio/est_src3.wav"></audio>] ] ] --- class: middle, center ## Practical Activity #2 Implementation of DUET